Risk Reduction
Velit can produce a range of depth conversions which can be analysed to provide volumetric probability distribution functions, spill point analysis and probability of closure maps.
Click here to view a webinar of the Risk Reduction capabilities of the software.
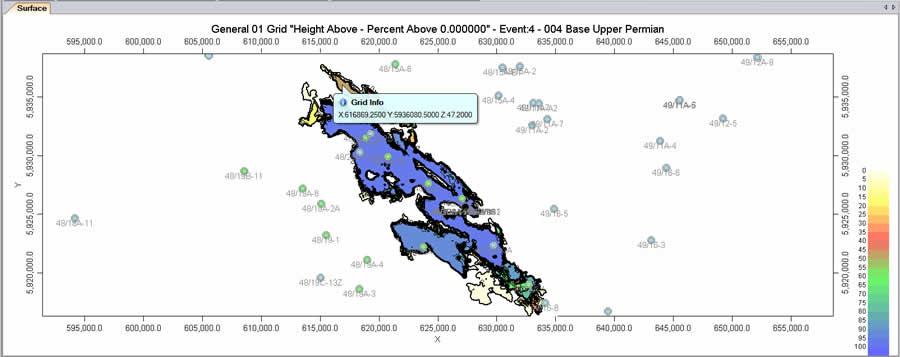
Probability of Closure
(The ‘Z value’ denotes the percentage probability that the structure is present, given model parameters)
Both vertical and lateral variation of parameters in the model can be stochastically varied within known bounds of confidence, range, fit and/or residual error as appropriate, decreasing the reservoir depth uncertainty. Gross rock volumes can be computed using any combination of upper surface, lower surface, contacts (constant or variable) or using fill to spill from a seed point. Multiple polygon sets can also be used.
Visualisation tools enable easy display and analysis of the results, and lever analysis enables deeper dives into which depth conversion parameters have the most significant controlling influence on Gross Rock Volume.
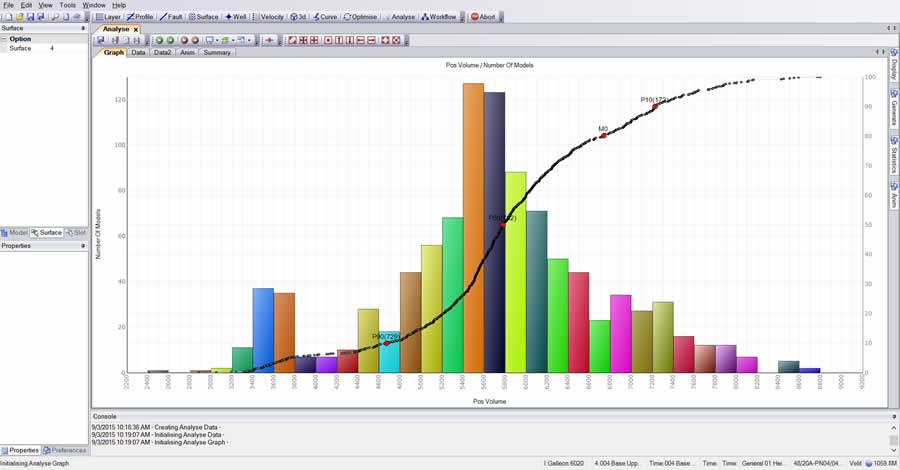
Histogram of GRV with P10,50,90
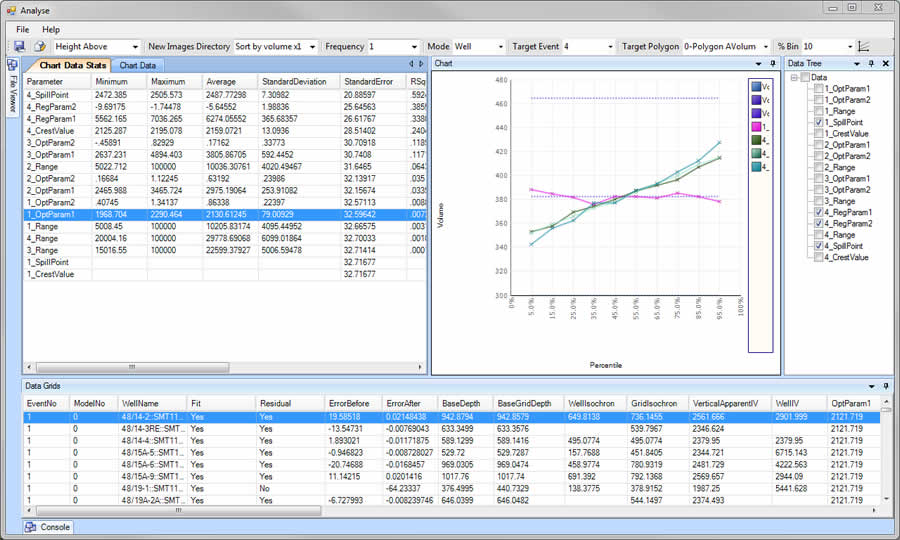
Determine Levers for GRV