The statistics dialog allows a selected statistical process to be run on the grids stored within Velit. A new grid will be produced and displayed in Velit.
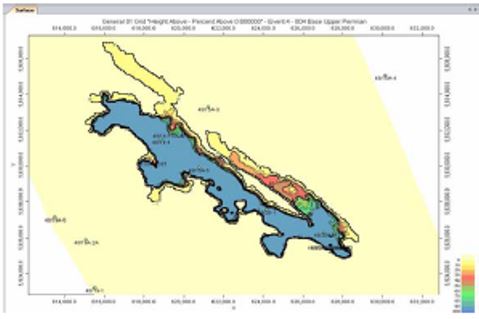
For example the technique will take all the ‘Height Above’ grids stored in the grid directory and for each node on each grid the value will be read and every time the value of the node is greater than a given constant a numeric one gets added to the count for that node. When all the grids have been read, a percentage value of number of nodes achieving a value greater than constant is assigned to that node in the output grid. This technique could equally well be used on a set of depth grids with the constant being defined as the oil water contact, for example.
Typically, in the centre of a model one would expect to achieve a 100% hit rate for this statistical process, while around the edges it would taper off – this is shown in the example: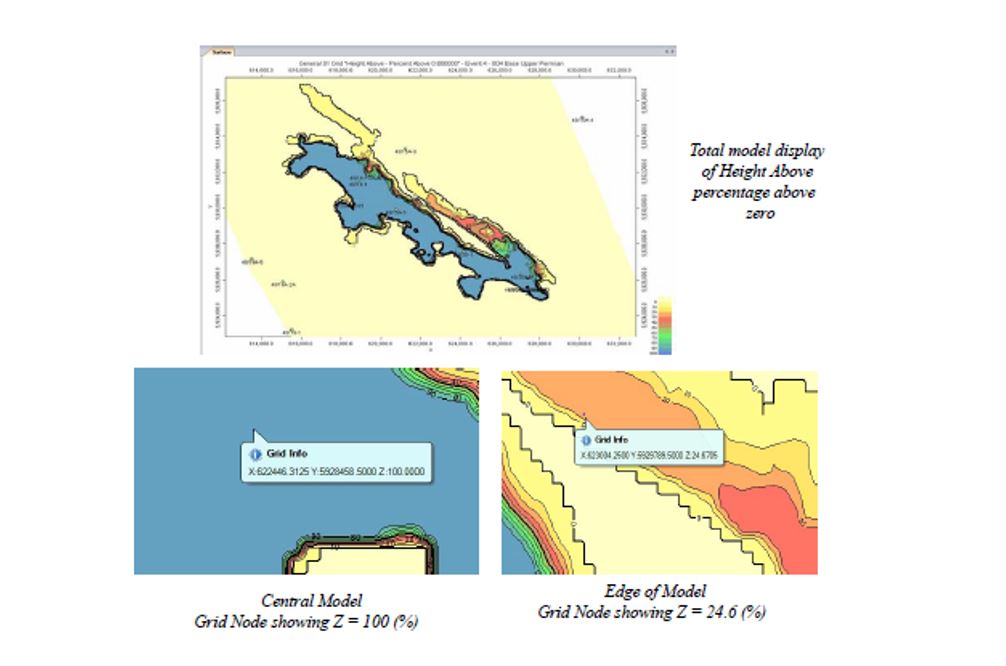
The Statistics dialog from within Velit will also allow you to generate a Volume from the grids set up in within the dialog.
The numerical value of the volume generated for the “one-shot” will be displayed in the Console window. The output volume grid, which defaults to being stored in the Surface dialog.
The “one-shot” option can be a useful method of finding the best point to place the Spill point. By setting the spill at various places and seeing what the resultant volume grid looks like and as a general QC tool before running a looping workflow.
Contact us for a demo!