An in-depth look at one of the features from the new Pre-Stack Inversion module available in the Kingdom Seismic Inversion module of Kingdom 2020.
The litho-fluid mapping tab is used to cross plot generated elastic parameters around a well.This allows you to cross plot the two selected volumes and select by means of up to three polygons the areas of interest. The areas selected in the polygons will instantly show up on the seismic display defined in the same colour as the polygon for traces around the selected well.
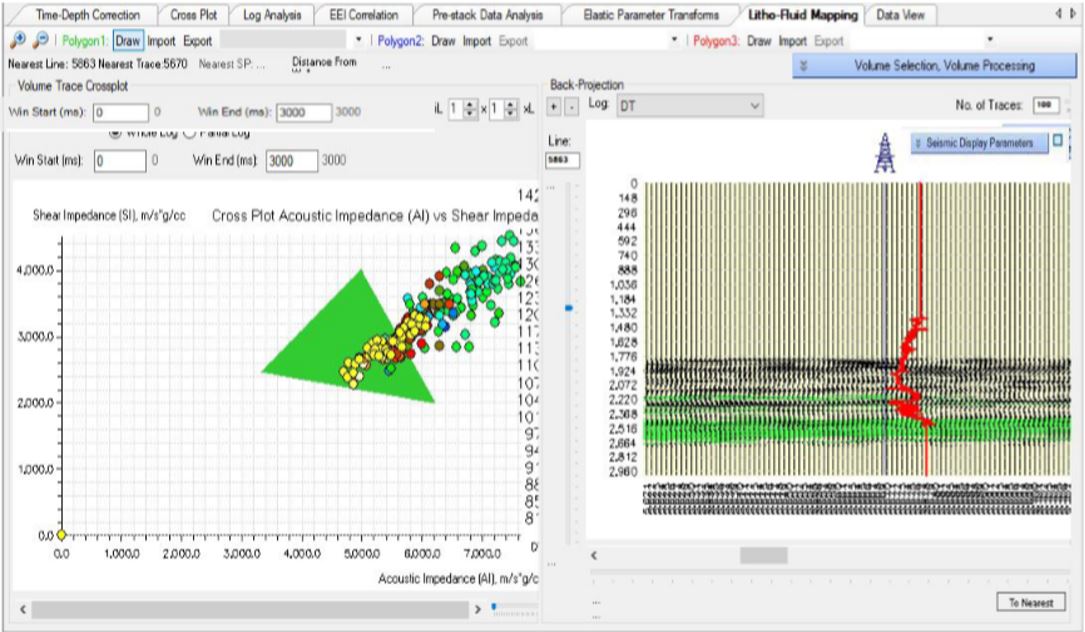
The number of points on the cross plot (coloured by a selected Elastic Parameter log as with cross plots) is defined by how many traces are selected around the well. The default is 1×1 trace around the well.
The seismic display shows a selected log at the well including 4×4 traces around the well. This defaults to being the inline closest to the well location. Once you are happy with the QC part of this procedure you can select an output volume name to produce which can be superimposed in Kingdom on the 3d visualisation module. In Kingdom, users can set up appropriate colour bars to visualize these volumes in both 2D and 3D. Note that highlighted areas by numbers -11, -22 and -33 in the output volumes are locations of mapped rock properties; they are NOT properties themselves.
Up to 3 polygons can be drawn over an area of the cross-plot. Drawn polygon points will then be seen in the drop-down and available to export as a text file. The polygons will be displayed in the colour relating to its polygon number; green, blue and red respectively
Volume Trace Cross Plot
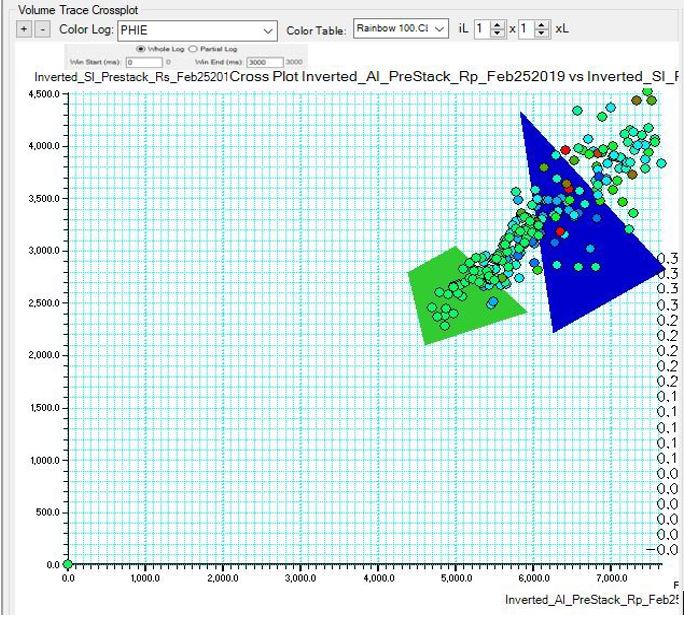
Select the Elastic Parameter log to be used to colour the data points on the cross plot with the opportunity to select whole of partial log the maximum and minimum values of the color key are obtained from the whole log. Selection of partial log is particularly useful if there are spikes in the logs so your window can be designed to avoid the spikes. Furthermore, a partial log may increase sensitivity of detection of interesting zones.
Back Projection Display
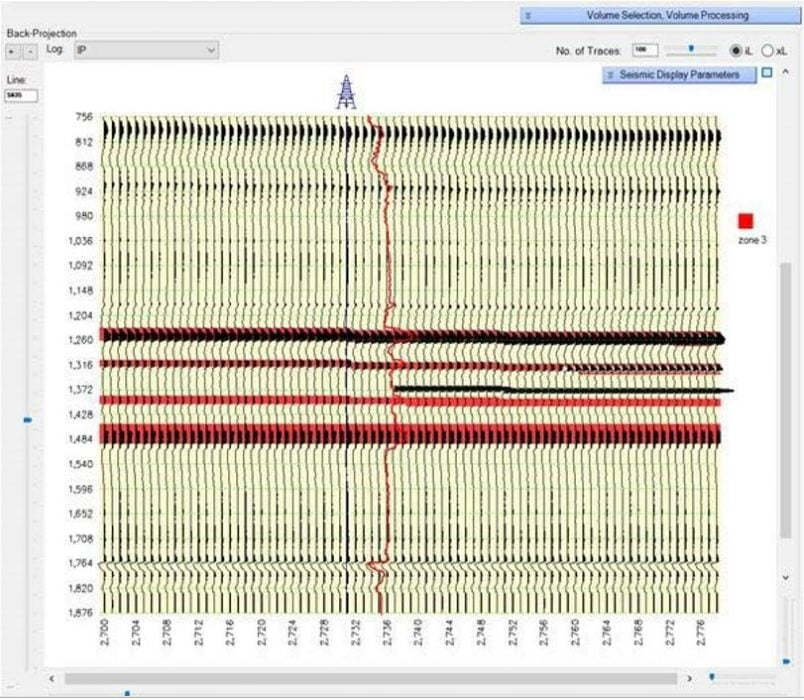
Slide through the in lines (or cross lines) to dynamically show the trace display away from the well. Select which log you wish to display at the well and the number of traces to be displayed to a maximum of 100.
Shade the wiggle display and set the Amplitude versus distance of the traces for either the trace display, the inverted traces or for log trace (within the inversion panel).