In this month’s behind the scenes look at LogToVolume, coming soon to provide you with next generation depth conversion, we explore the Framework element of the toolset.
The following snapshots of the software are not in a finished state, as they are missing icons and the final aesthetic details of the finished product, however you will get a feel for the ease-of-use of the tool and gain an understanding of the step-by-step nature of the final result.
There are several steps to take in selecting the data you wish to work with, using the Data Loader tool, which we may cover at a later date. If we assume that you’ve got your data in good order you can then opt to use the Framework Wizard.
Framework Wizard
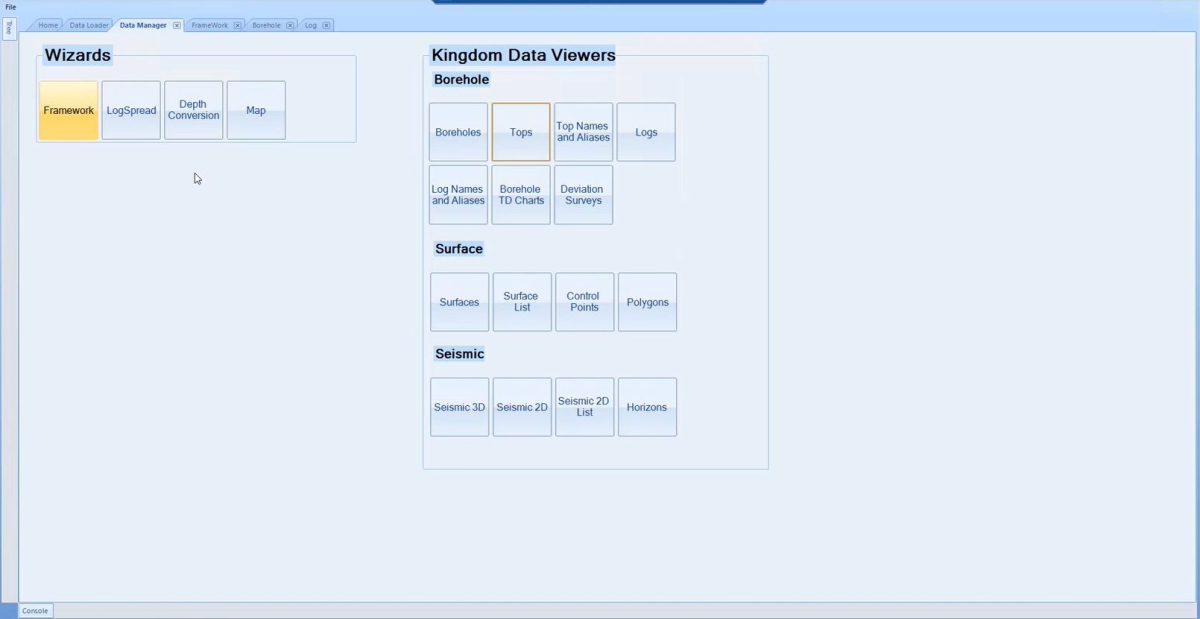
You’ll also see a number of other utilities contained within the toolset, in the image above, that you can interact with on your journey through the software to ensure the volumes you generate with LogToVolume will be accurate and robust.
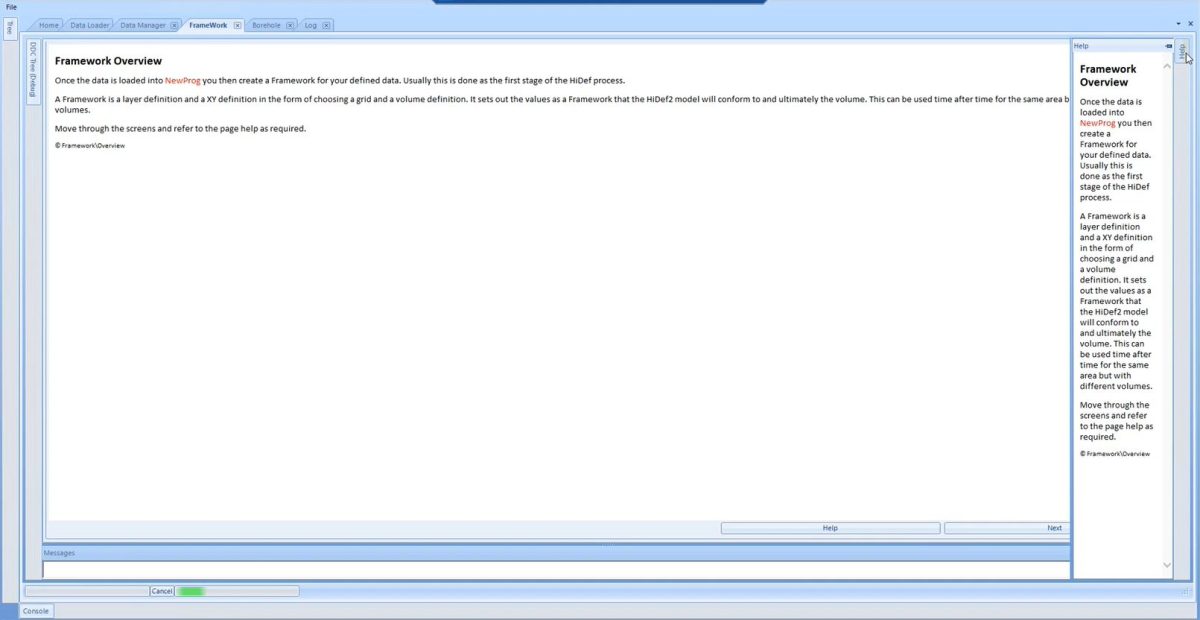
Framework Overview
Once you’ve selected the Framework option, you’re presented with this Overview page and there is also a Help dialogue on a flyout to the right hand side, which will guide you through the software page by page. You then will have Previous (in the image shown as help) and Next buttons at the bottom right of each page, which will enable you to step backward and forward through the Wizard.
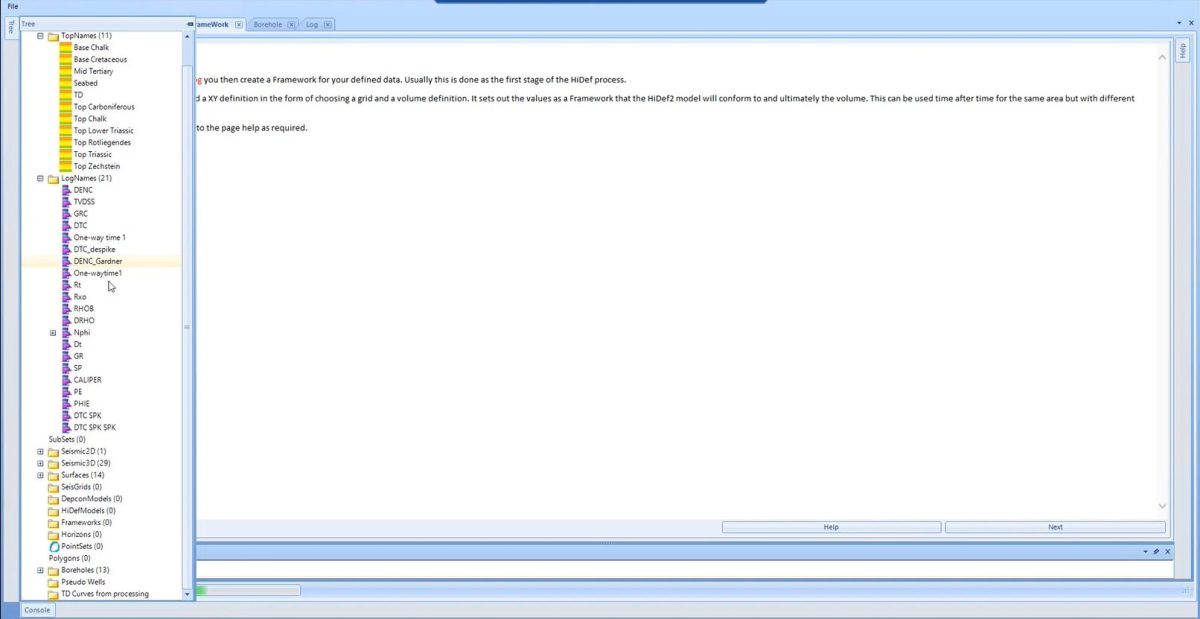
All the data available to work with in the project is contained within the project tree (the top left flyout), which uses an “Object Oriented” design philosophy, such that you have fully visibility and control over each data element.
When you’re happy to proceed, press the Next button.
Framework Type
Here you can select to make a New Time Framework, Load an existing Framework or Load a framework which has been created in Kingdom’s Dynamic Depth Conversion tool. In this article we will cover the creation of a new framework, called “fw 1”. Once you have chosen your option, you can press Next to continue.

Framework Grid Selection
The next thing to do is the select the time grids you wish to use for the framework model. You’ll drag and drop the grids from the selection tree on the left hand side, to the framework tree on the right hand side. These grids can be brought across in any order, but you are then required to adjust the ordering of them, such that they conform sequentially from Surface to Depth. We would recommend editing the name of your grids and adding a number at the start, such that it is easy to see that the time grids are sorted in this way.
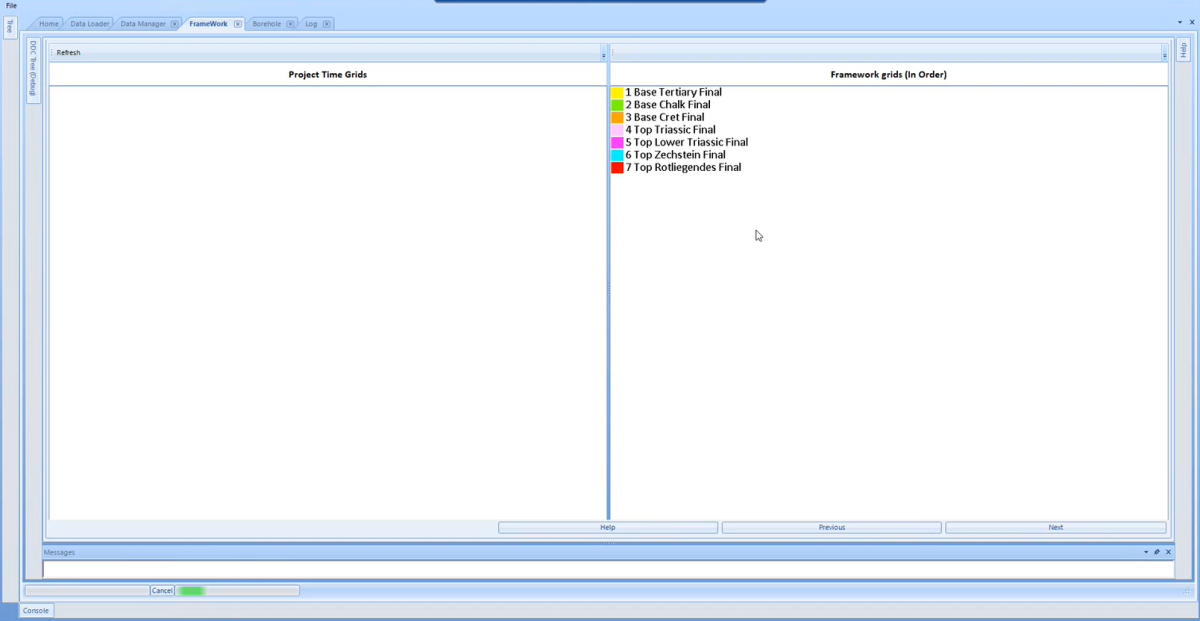
As you can see in this 7 layer model, we have numbered each grid as it can be easy to drag across grids and incorrectly arrange them.
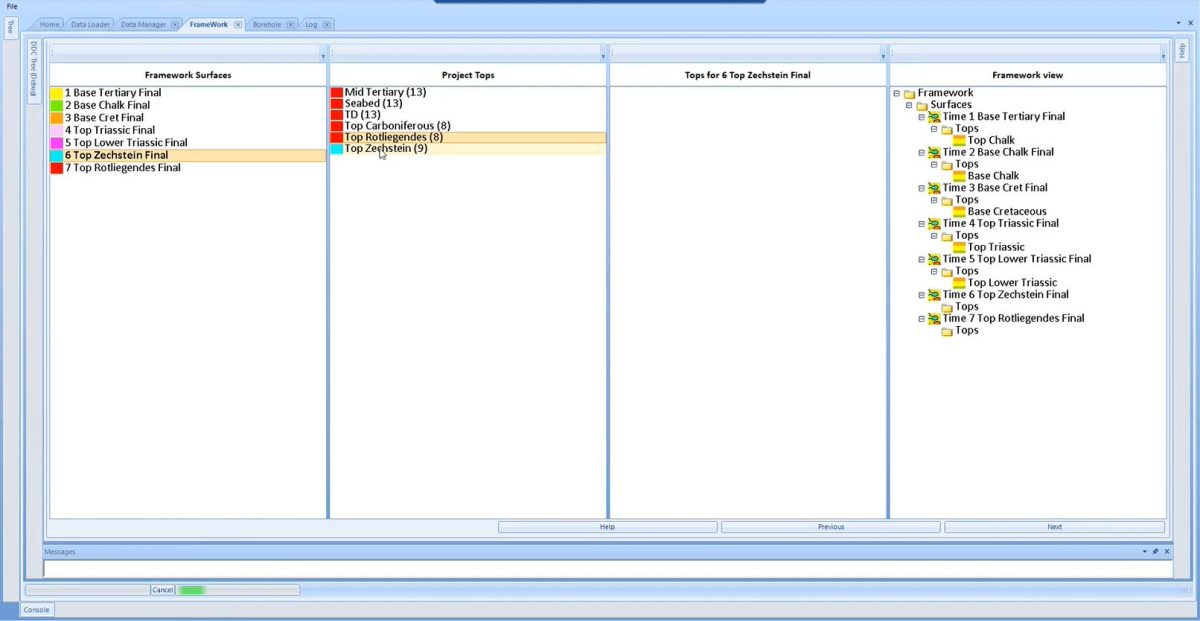
This next screen shows the time surfaces, the formation tops that you will correlate with those surfaces, any aliased top sets and a final framework view. In this snapshot you will see that the first 5 layers have been defined in the framework and you are simply corresponding the relevant surface (6 Top Zechstein Final) with the top (Top Zechstein (9)). The number in brackets after the tops relates to the number of tops available in the current well set. After completing this process for all the layers of your data, you’ll press the Next button to proceed.
Framework Geometry
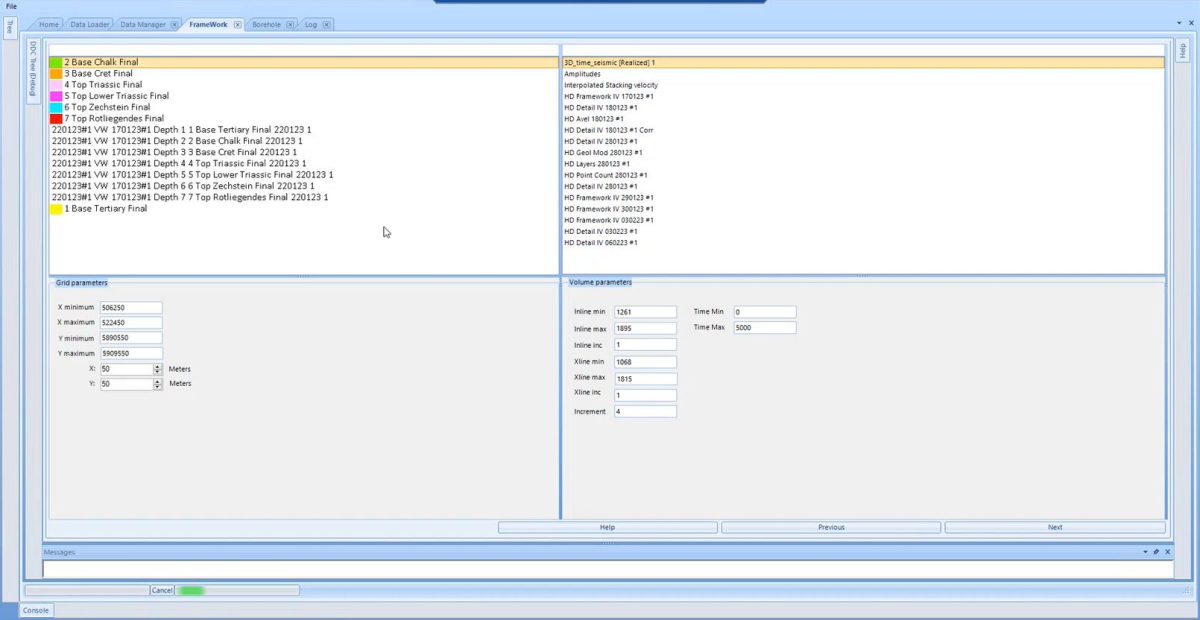
At this stage the software defines the 2D (grids) and 3D geometry of the Area of Interest of the framework. To the lower left section you can see (and adjust if required) the X and Y minimum and maximum parameters of the Grids, while to the right hand side, you can similarly interact with the Volume parameters. With these selections being confirmed, you can press Next to contine.
Framework Geological Model
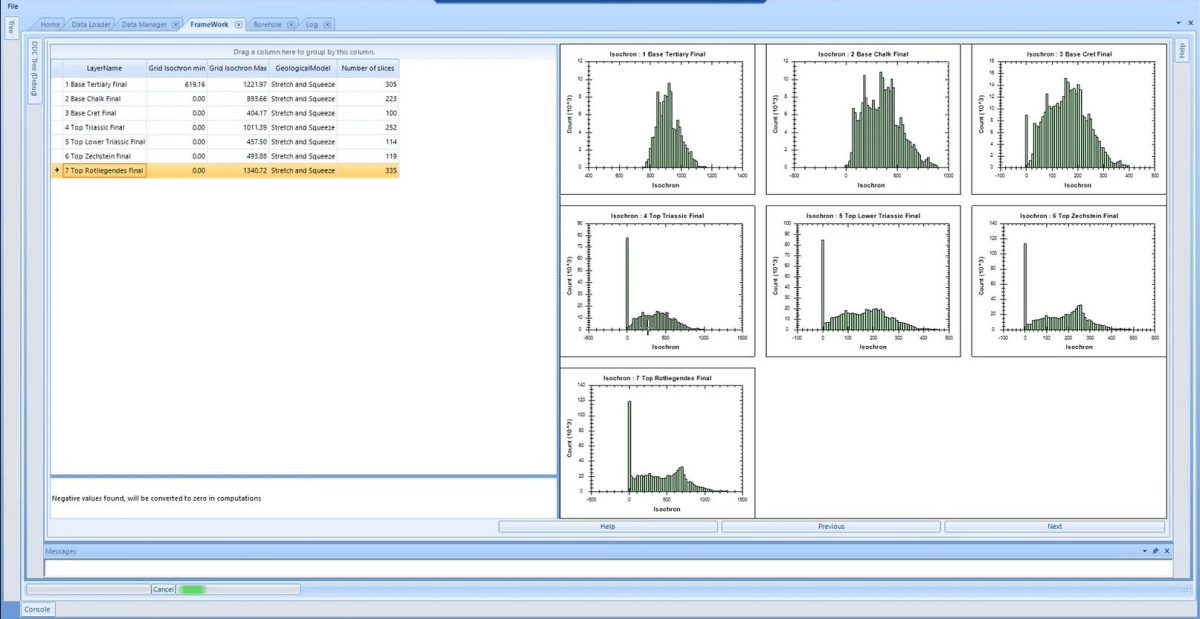
At this stage the software will now automatically compute the isochrons for each layer. This also provides you with a visual reference as to whether you have got the time grids selected in the correct order. As you can see in the image below, there are 7 graphs generated, which the isochron values shown along the X axis. In this dataset there are numerous layers that conform around a salt dome, such that layers 3 through 7 have many overlapping samples at the 0 value.
The main aspect of this step is to choose the Fill Type for each layer of the Geological Model, where you can select to either Cut from Top (Surfaces parallel to the base of the layer), Cut from Base (Surfaces parallel to the top of the layer), or to Stretch and Squeeze (where the fill will be proportional and will thicken and thin according to the relationship of the surfaces that bound the layer). This will require you to look at your seismic amplitude volume and gauge which of the 3 fill types would best describe the layer you have interpreted.
On this page you can also see the number of slices that the software will break each layer up into. We are defining LogToVolume as a Next Generation Depth Conversion tool, as it will break from the convention of simply using a vertical line (constant) a line at an angle (linear regression) or a line with a curve (a function with an exponent) for each layer. Instead, by creating hundreds of layers between each interpreted horizon/grid, these micro layers will enable you to achieve a depth conversion which will be more accurate than using a single mathematical function to describe the velocity changes of the layer, as the depth converted volume will contain the velocity information at log-level detail. The caveat here is that the tool will require you to have reasonable coverage of wells across your dataset to perform the interpolation in a geologically sensible way. If you are working with sparse data, then VelPAK/Velit will still be the tool of choice.
After you have worked through each layer and decided upon the fill type of each layer, you press Next to continue.
Framework QA
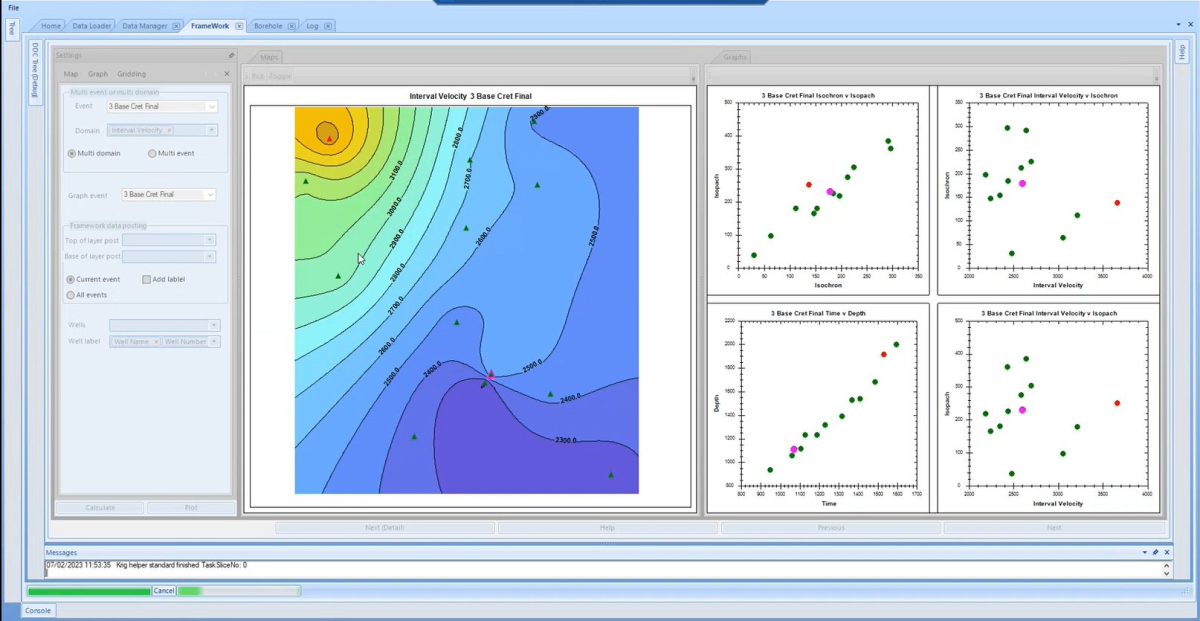
The software now takes the pseudo velocity of each layer and performs a depth conversion based on the grid of Vertical Apparent Interval Velocity for each layer. This can be a good way to establish whether or not you have any “bad” data in your dataset, as the interval velocities for each layer should look “reasonable”. You can also see that there are 4 graphs displayed to the right hand side of the map. These contain the wells plotted against different axes. You can interact with each graph and see the corresponding well on the map.
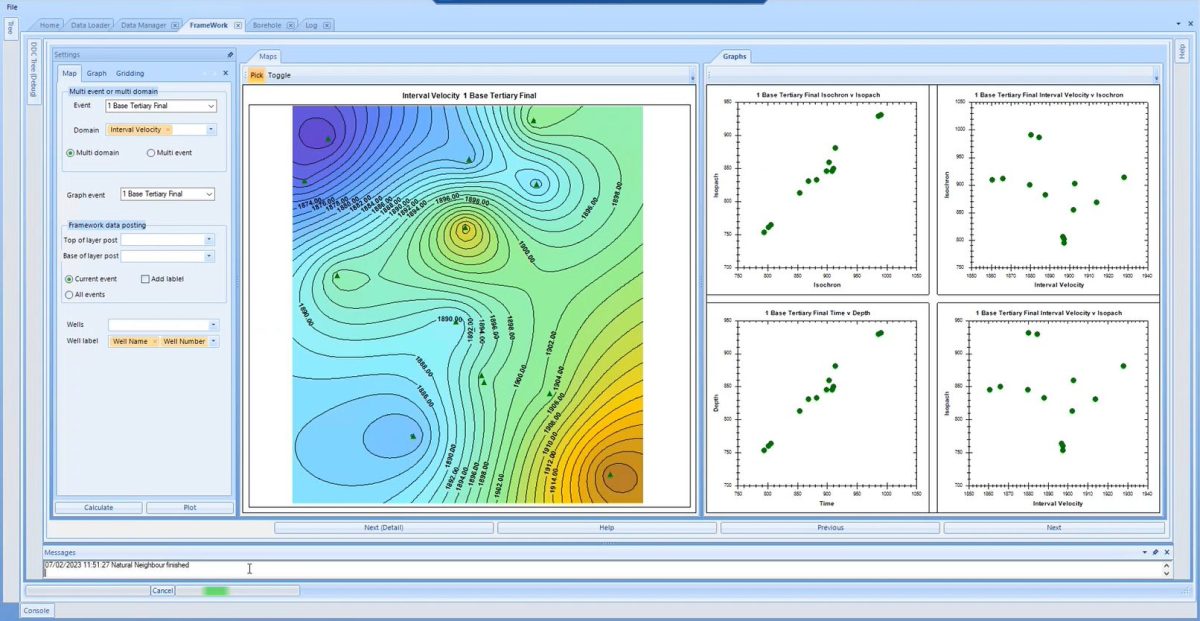
For example, here you can select an outlier (on the map or graph) and use the Toggle button to turn that data point on or off for the layer. After editing, the software will automatically recompute the maps for all layers, such that you can QC the effects of selecting/deselecting certain data to be included/excluded from the model. Below you can see the deselected data point in red and the highlighted data point in pink.
The image below now shows the impact of deselecting the well to the north-east and the resulting Interval Velocity map.
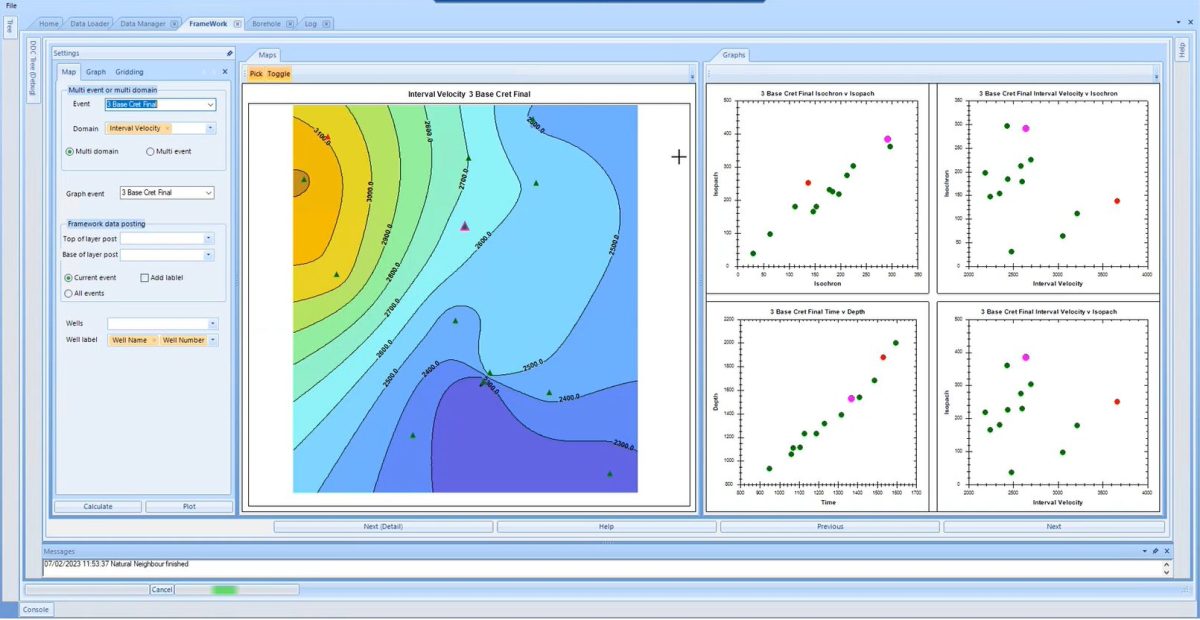
You might have noticed that the missing element from this page is a colour bar and colour bar editor. This is yet to be completed, but will be available for the release version of the software.
All these steps are performed within LogToVolume to specifically QA the data (and not to perform the final depth conversion), as it can be very useful to be able to visualise and manipulate any data which may adversely affect the quality of the final model.
After you’ve concluded this step, you can press Next to proceed.
Framework Data Sheet

On this page, you can access all the data contained within the software such that you can query any given value that the software is working with. Normally, you wouldn’t have to necessarily look at this page, but it is available to you in the instance that you do need to check something specific.
You can press Next to move to the last page.
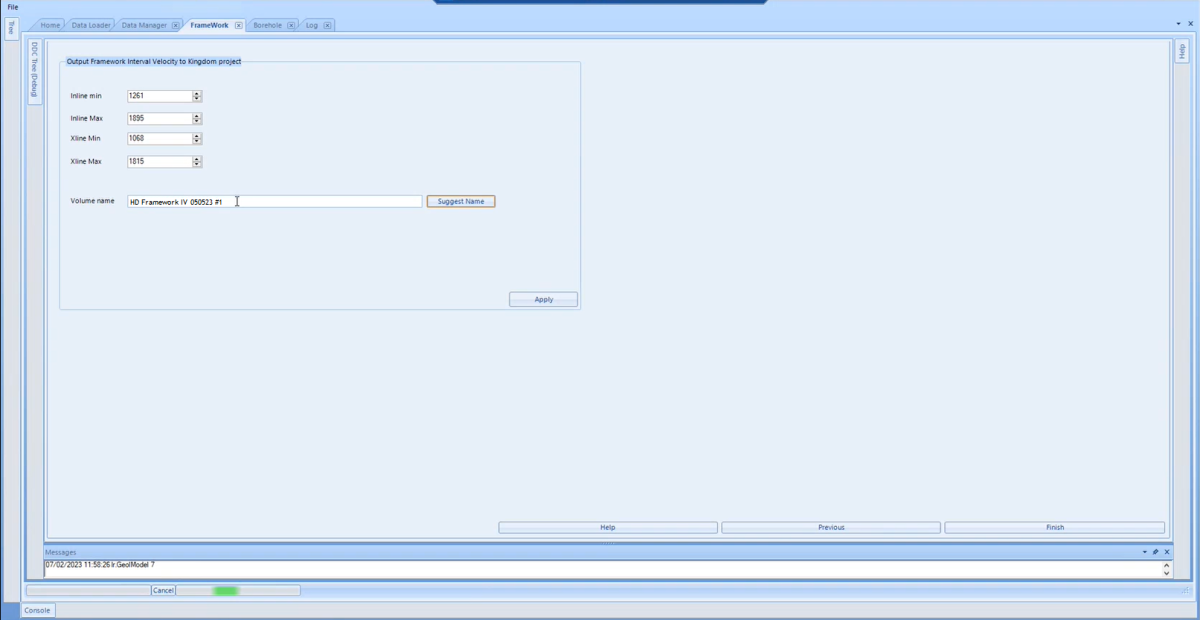
Output Framework
The final page of the Framework Wizard is where you create the Framework Interval Velocity, as part of your parent Kingdom project. On this page you can enter your own name for the volume, or you can use the “Suggest Name” button to generate a name of the volume for you. The advantage of using this button is that if you create multiple volumes each day, the software will give each model a unique number and incorporate the date, such that they are more easy to work with in Kingdom.
Pressing Finish concludes the process. Once the Framework has been created, this is now a valuable input during the LogSpread and Depth Conversion modules, further along the workflow. We’ll look into these respective modules over the coming months.
If you have any questions about the new developments of our software, or want to discuss our other products, or the depth conversion training courses we provide, then please get in touch with us at sales@equipoisesoftware.com where we’ll be happy to discuss your questions in more detail.