“A little learning is a dangerous thing; drink deep, or taste not the Pierian spring: there shallow draughts intoxicate the brain, and drinking largely sobers us again.” – Alexander Pope 1711 AD
Perhaps one of the first equations you ever learned as a child was Speed = Distance/Time. You might have seen this in a triangle, with D at the top and the S and T at the bottom, with your teacher explaining that if you want to rearrange for Distance, you simply multiply Speed by Time.
With respect to Depth Conversion in the Oil & Gas industry, you might imagine that with everyone having this equation ingrained within them since their early years, that the industry should be awash with geoscientists who can confidently predict depth to target. However, today it would seem as though ‘confident depth converters’ are few and far between.
The issue we face as an industry is that the subsurface of our world is a rather complex place, with respect to its geology and the variations of the speed of sound through differing rock types. Unfortunately, this creates nuanced velocity scenarios, and it is these nuances which require our attention, as mis-predicting depth can translate into a significantly expensive mistake.
For sedimentary rocks, typically as successive material is deposited above a given layer, the rock gets buried, the particles are squeezed together and the velocity of the rock increases. This common ‘increasing velocity with depth’ trend can be solved by plotting V0 (the velocity at time 0) and K (the compaction trend and gradient of the line) to describe this incremental velocity change with depth.
The Common Mistake
V0K is such a well-known function used to depth convert geological units that display a linear increase (or decrease). But, did you know that this function is commonly mis-used? Most velocity analysis packages use a least squares linear regression in the Interval Velocity v Depth (IV v Z) domain when estimating V0 and K. This includes Petrel, and in ‘normal’ use MS Excel.
Petrel has other options too:
- Calculate best fit individual V0 and K (and other functions) for multiple wells over an interval
- Fix either V0 or K (usually K) and vary the other variable for multiple wells
- Calculate a single best fit V0 and K over an interval for multiple wells
- Provides options to minimise depth errors (in some workflows)
Petrel does not automatically produce cross plots for QC and so noise, velocity spikes and poorly conditioned data can influence the result without you realising. The main issue here however, is that all these functions are calculated in the IV v Z domain.
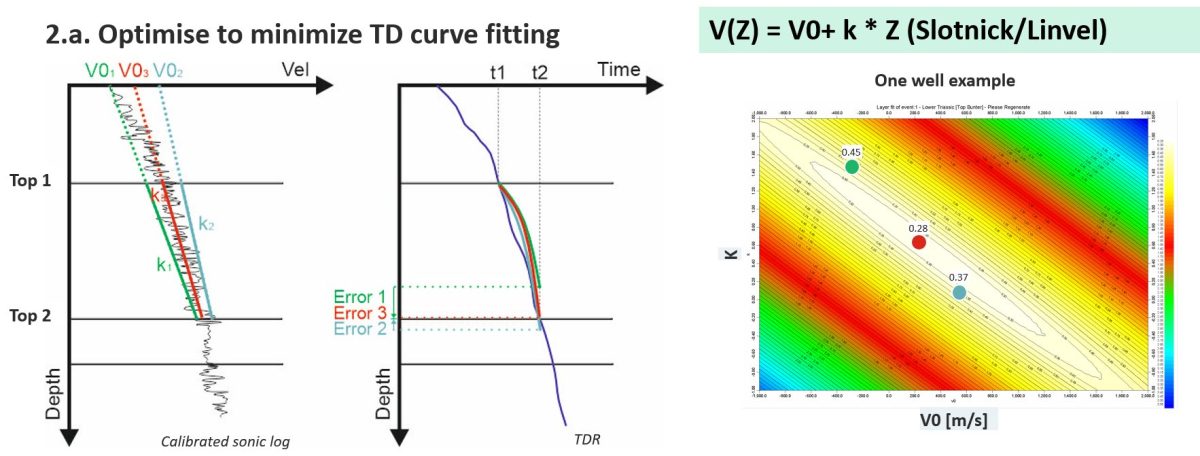
Presentation courtesy of Nigel Pike – CNOOC International
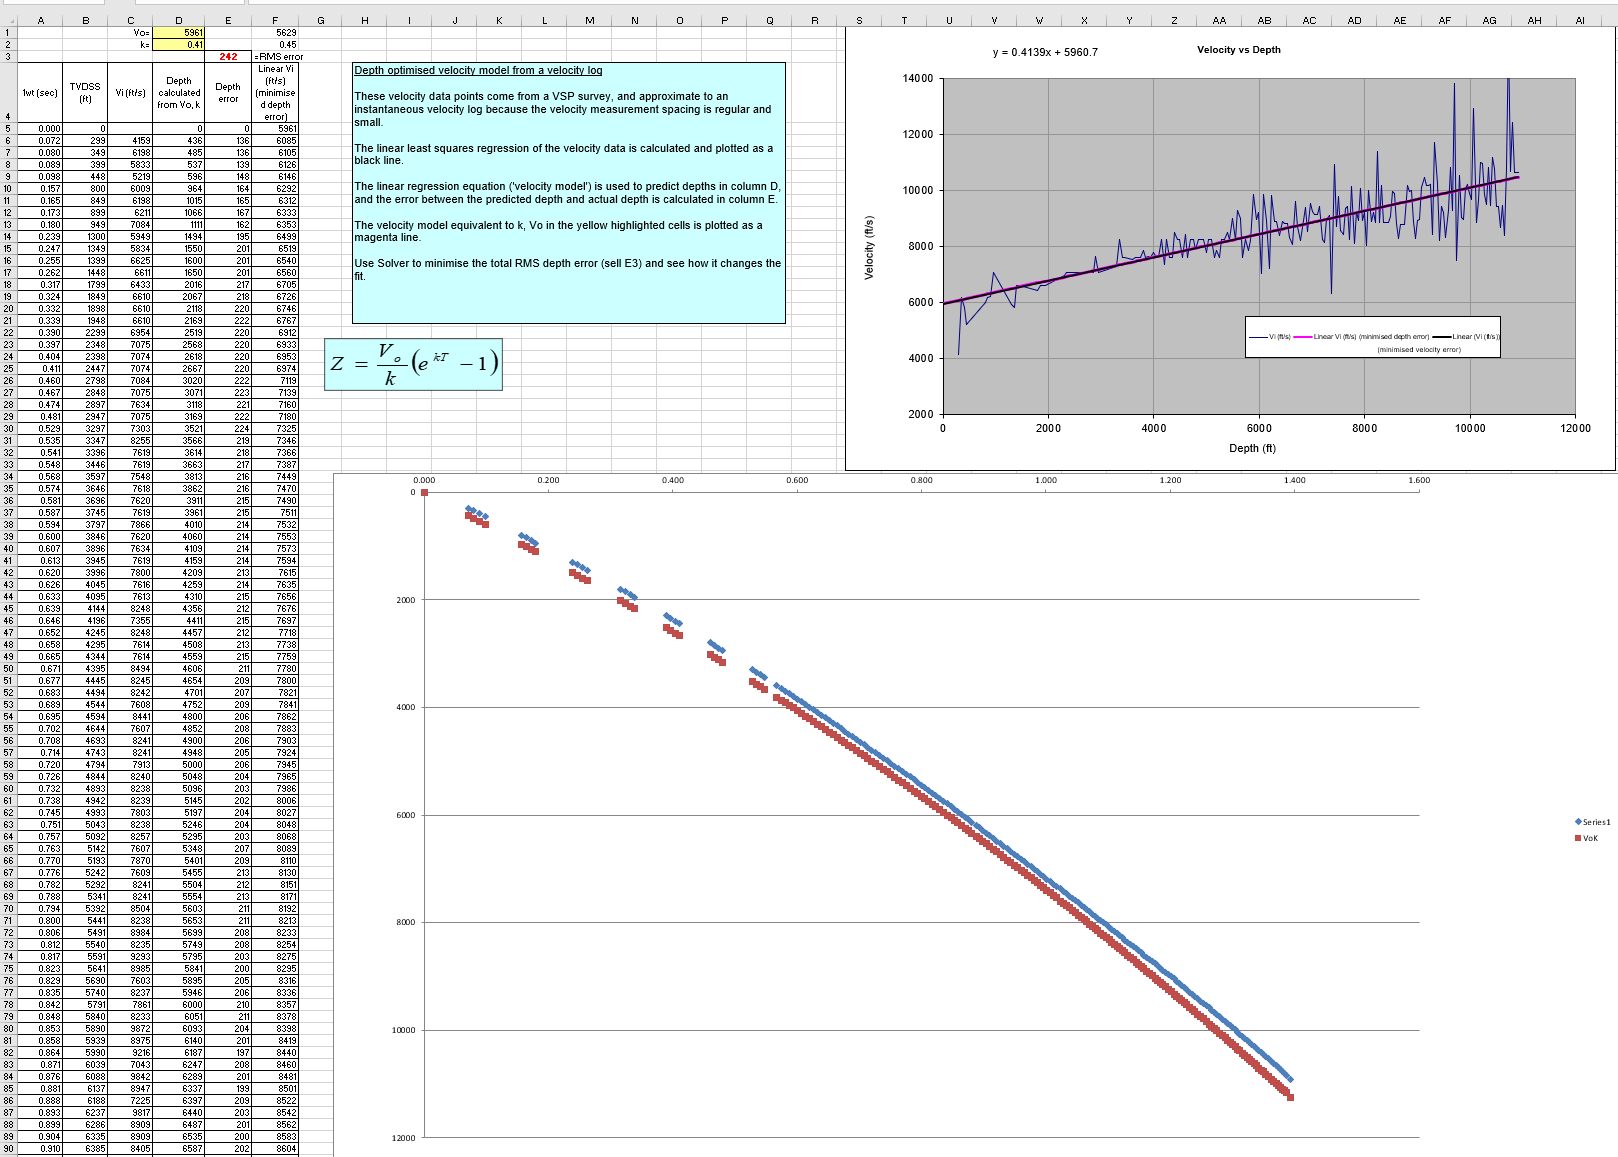
In the MS Excel plot above, (grey background) you can see that a V0K regression line has been calculated (in black) as a best fit to a sonic log from a single interval in the IV v Z domain to generate the V0 and K parameters (Petrel will be doing something similar). NB, you should always run your analysis over a single interval but data from multiple wells can be used.
The regression parameters from this plot are entered in D 1 & 2 to parameterise the V0K function in the blue box and are used to produce the modelled Depths (column D) and displayed as the red line. Not surprisingly, the red modelled V0K line perfectly overlies best fit black regression line in the IV v Z plot.
However, all is not well in the Time v Depth domain!
The blue curve (white background plot) is the actual 1WT and TVDSS plotted from columns A and B
The red curve (white background plot) is the 1WT and modelled Z from the V0K function with the ‘best fit’ parameters in IV v Z.
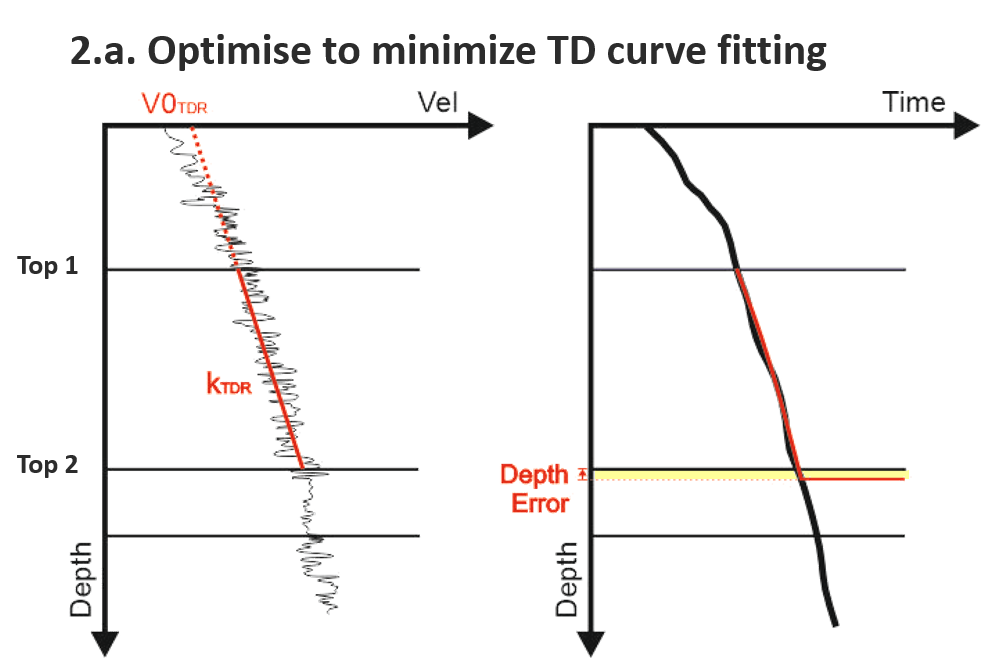
The Lesson
Always look at T v Z plot to see how any analytical velocity function fits the real data in the interval, over which it was derived and will be applied. This V0K function as parameterised is clearly wrong despite it having been derived from a best fit line in the IV v Z domain.
Velit Works Differently
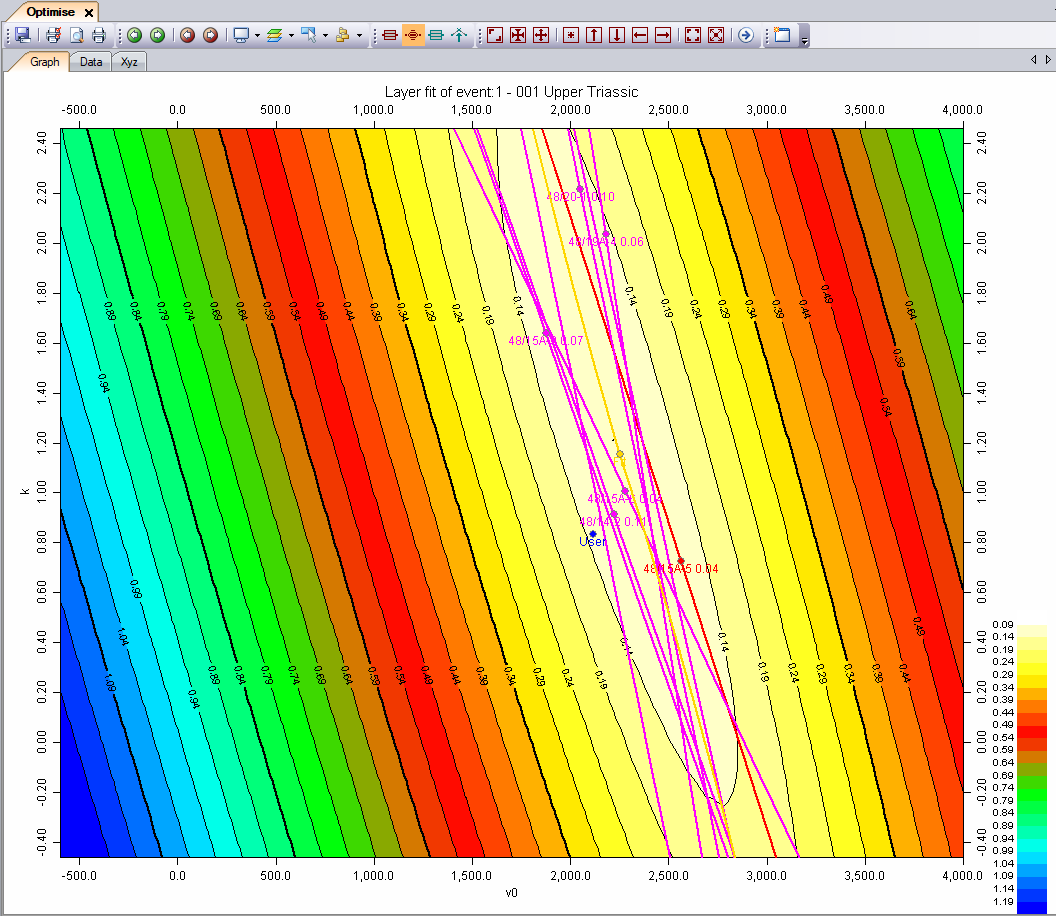
V0K solutions are non-unique. Dr. Al-Chalabi’s work on solution ellipses describes how a range of V0 and K values can give an equally good fit to any single well. This can be extended such that a single V0 and K parameter can adequately fit multiple wells. In the instance where the base of the solution trough witnesses two or more clusters of wells either side, it can indicate the presence of uplift or a facies change within your dataset. This work is incorporated into Velit’s Optimise module as a robust method of predicting velocity away from your known control points for any intervals with an increasing/decreasing velocity trend with depth.
Presentation courtesy of Pablo Borghi – Wintershalldea
By performing the fit in the Time domain instead of the Interval Velocity domain, Velit provides you with the accuracy in depth that you are searching for. You will also note that this tool will generate a degree of depth error too, but that in itself can be a valuable!
The benefit of utilising this technique is:
- The velocity model is independent of the seismic interpretation.
- It can estimate a reasonably good result even with only one well.
- It honours the well velocity data as much as possible.
- The residual depth errors offer the opportunity to evaluate the difference between model and reality.
- The depth error can be corrected later in different ways.
Final Remarks
A velocity model should approximate the velocities of the subsurface and predict velocities away from your known data points. Velit’s Optimise module can be considered as a key component in gaining accuracy in depth, as it avoids the common mistake of working in the IV v Z domain, instead working in the T v Z domain. The strength of using such an optimiser lies not only in the accuracy of estimating V0K, but mainly, its in the ability to QC your data and results in a more meaningful way.
If you can’t currently perform this workflow in your existing software, then please get in touch with us now and we can arrange a demonstration and an evaluation licence for you to see the value when applied to your datasets.
If you’d like to know more about Velit, then click here. To contact us for a free evaluation e-mail us on sales@equipoisesoftware.com.
The software is provided by S&P Global (who we partner with for Kingdom) with perpetual and subscription pricing available on request. We offer a series of Teams meetings throughout the evaluation to help you step up the learning curve and enable you to see results for yourself. We also provide a series of Depth Conversion training courses which you can click here to find out more.