Analytics
Velit incorporates Cross-plots, Histograms and numerical optimisation, enabling you to interrogate the well and processing velocities in many different ways, manually, or by utilising our pre-defined workflows.

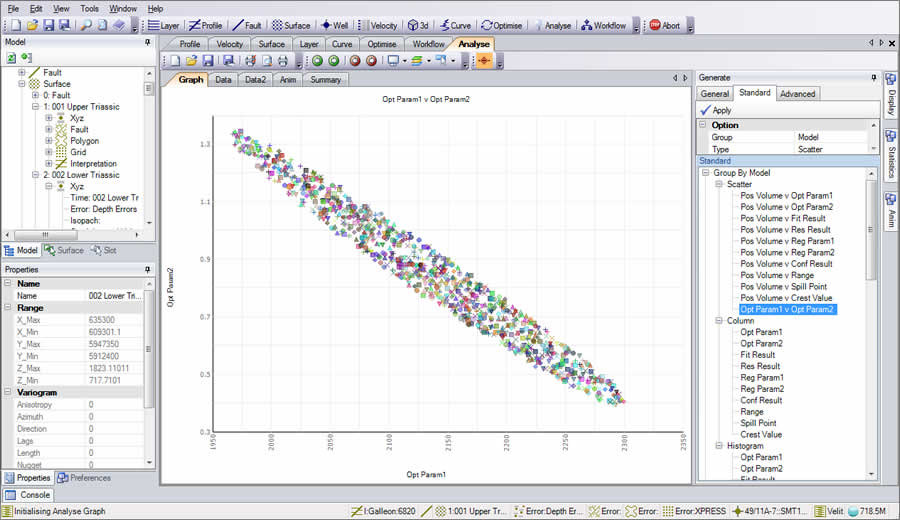
Numerical Optimisation
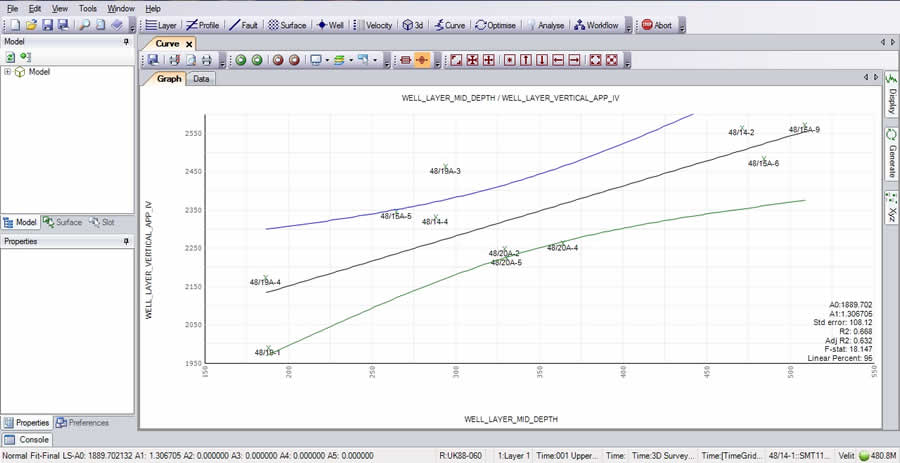
Comprehensive Graphing
There are many different methods for analysing your well velocity data. Each time you see data from a different angle you get a better understanding of your velocities and the way forward for building your velocity model with stochastic simulation being provided to assess the depth uncertainty.
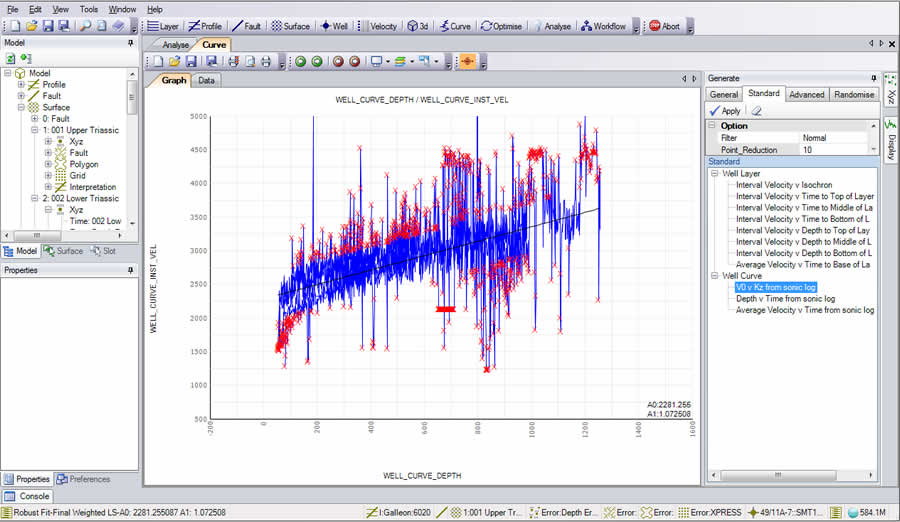
Robust Fitting
Data Grid Graphing Example