This article covers the steps required to transfer data from Petrel into Velit, and highlights several key points to ensure that your model will be built smoothly. Of great significance to this, it is vitally important to ensure that your data (sonic logs, formation tops, time grids, seismic velocities) have been thoroughly conditioned before you get to working in Velit.
Velit DE is a Petrel plugin which enables data to be transferred from Velit to Petrel and back again.
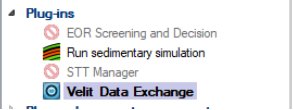
This should already be installed within Petrel. If not, contact your Systems Administrator. Once installed, Velit DE is found in Plug-In section of the process.
On selecting Velit DE, a directory structure will pop up allowing you to select where you want to put your Velit model and accompanying directories.
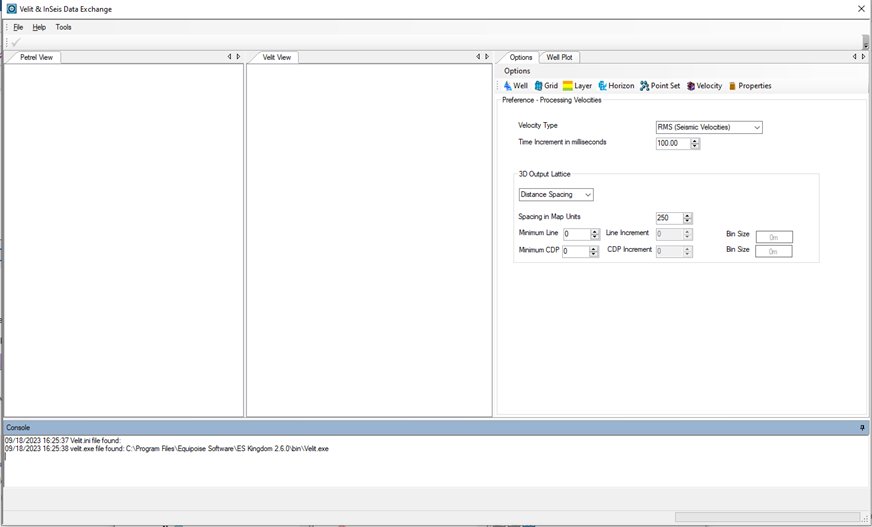
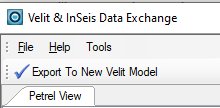
The Velit DE screen will appear.
Go to the top of the VelitDE module and click on File – > Velit opening up a number of options.
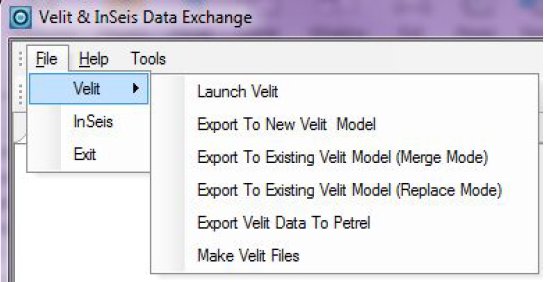
Select ‘Export to New Velit Model’. Enter a name for your Velit project.
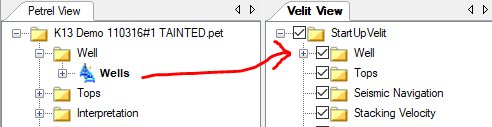
The two panes will be populated with two trees.
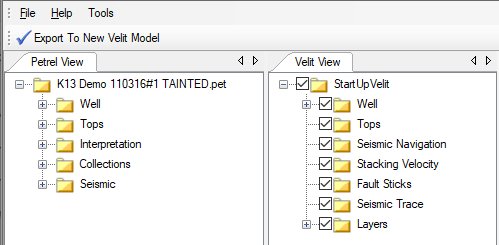
The Petrel view on the left represents the Petrel project tree using the same structure and project names that exist in the Petrel project – but note only the data that is relevant to Velit is included.
The Velit view in the middle pane represents the data you wish to transfer into Velit and is of course empty to begin with. The transfer data is accomplished by dragging an item from the Petrel view tree on to the appropriate path of the Velit view tree.
Note: VelitDE will not allow an item to be dropped onto an inappropriate part of the tree.
Drag the Wells from the Petrel tree into the Velit tree – left click and drag and hold the well across to the wells folder in the middle pane.
Velit Data Requirements for Wells. Velit is able to fit functions to any Time-Depth curve data including calibrated or uncalibrated logs or even checkshot data. It is however, limited to only one time-depth curve per well. Therefore, the data selected for each well should be the curve data that is considered to be the best quality.
Looking at the right-hand panes of the VelitDE screen, you can see here that the well options selection preferences enables us to officially control selection of data – the default option Sonic logs then checkshot tells Velit DE to select the Sonic log in preference to a check shot survey.
If no sonic log is present the checkshot survey will be used. This might be sufficient to select the appropriate data but often the data will comprise a number of sonic logs and checkshots maybe from different tools. Using the tree to manually select the data can sometimes be cumbersome so Velit DE also lists the data in the form of a table. The table can be set to display in a number of different modes making the bulk selection of a particular set of data much easier.
By default, data is displayed by well which is convenient if you have relatively few wells. Alternatively, if you wish to select specific log curves or have many hundreds or even thousands of wells, grouping by log curve name may be more convenient.
Once you have selected the well data, you can move to choose other data to bring into the Velit model.
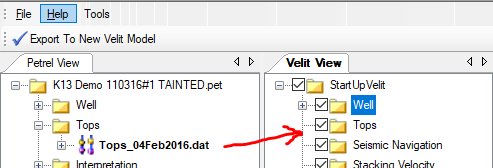
For well markers or formation tops we can drag the appropriate tops set over to the tops folder in the Velit pane.
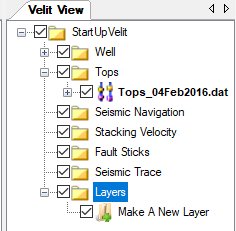
The key to building a Velit model is the selection of the interrelation form of the surface or grids – the model building process begins in Velit DE, so the next thing to do is define the number of layers to be used in the modelling process. These are defined in chronostratigraphic order.
Open up the Layers folder and select ‘Make New Layer’.
 Open up the branch under Layer 1.
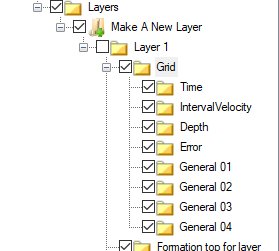
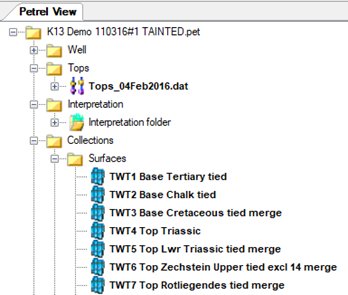
The grids in Petrel are stored in the Collections -> Surfaces branch. Open this branch up on the Petrel pane.
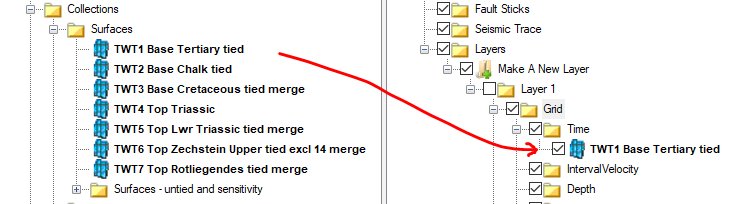
Move/Drag the TWT grid for Layer 1 across from the Petrel pane to the Time slot under Layer 1 in the Velit pane.
Do this for all layers in the project.
Tip: Hovering over the Layer Branch and the Grid branch will automatically open up the branch allowing the Time Grid to be dropped in to the correct slot.
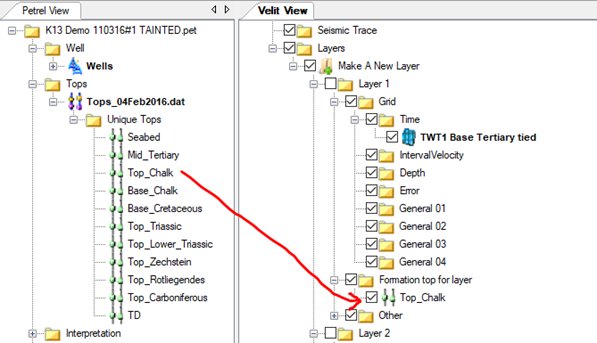
When you have all surfaces dragged across to their corresponding slots in the Velit pane you need to ‘link’ the formation tops to their corresponding time grid surfaces in the Velit pane. This is an integral part of the Velit process!
Fully open up the Tops branch in the Petrel pane and drag the correct Top to the ‘Formation top for layer’ slot under the correct layer.
When all the tops have been moved across to the ‘Formation top for layer’ for each Layer we can look at the Layer tab to check to see if there are any issues with the data in terms of the layer definition between the Surface and the Top associated with each layer. If there are issues, the software will flag them up!
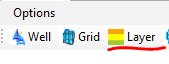
Click on the Layer Tab.
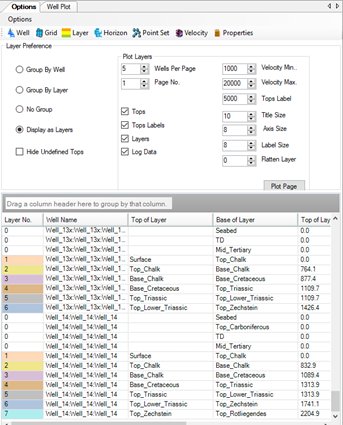
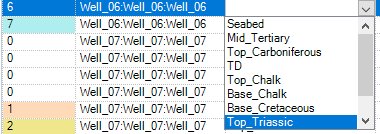
Use the scroll bar to the right of the bottom right pane to scroll through the list of wells. You can see the colour-coding describing the layer definition.
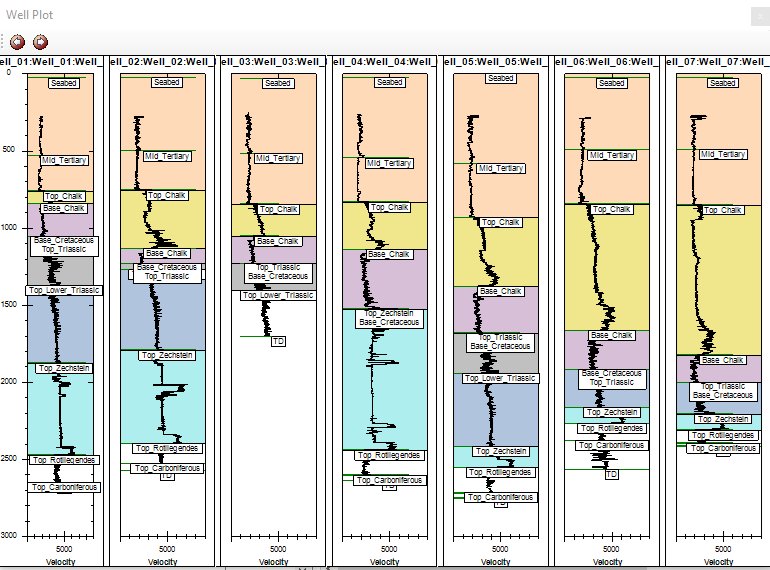
Click on Plot Page in the top right pane.![]() A set of well curves and their layer definitions will be displayed using the set-up values from the top right pane allowing you to check that the layer definition looks correct.
A set of well curves and their layer definitions will be displayed using the set-up values from the top right pane allowing you to check that the layer definition looks correct.
If you need to, under the Options tab, on the bottom right-hand pane scroll down to these wells to ascertain why no colours are showing and assign a layer.
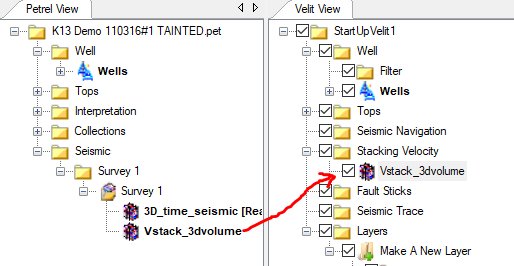
The next thing to do is read in stacking velocity data.
Drag across the required volume to the Stacking Velocity branch in the middle Velit pane.
 The right-hand pane showing the preference options for processing velocities will open up.
Note that if it was not RMS velocities we were reading in we would change the ‘Velocity Type’ drop down to whatever type of velocity it is, for example. You may also need to consider the Time Increment and the 3D Iline/Xline extent.
This concludes the selection of data from Petrel that we are going to be reading into Velit.
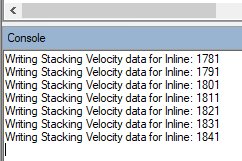
Press Export To New Model.
 You will see the progress in the Console at the bottom of the Velit DE screen.
When VelitDE has finished, the main Velit software will pop up.
Note that in the very top of the Velit program the name of the project you initially called your Velit project will be displayed. The very first thing to do is SAVE YOUR MODEL using the standard ‘floppy disk’ save icon!!
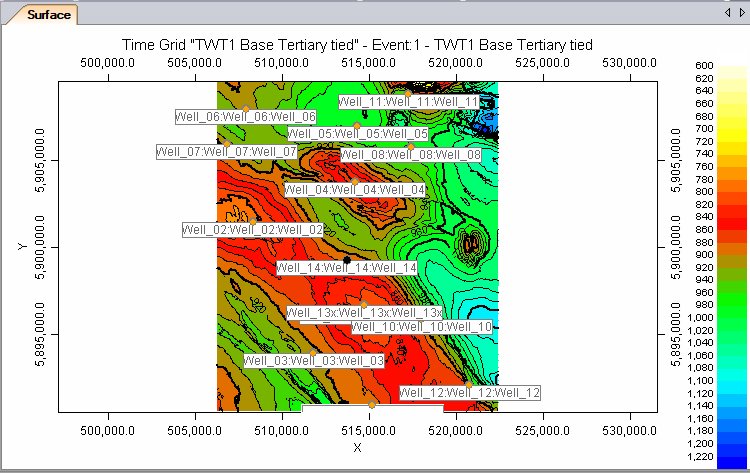
You can then view your data in Velit.
If you would like to know more about Velit on Petrel then click here. Alternatively, you can contact us for a free evaluation by e-mailing us on sales@equipoisesoftware.com.
The software is provided by S&P Global (who we partner with for Kingdom) with perpetual and subscription pricing available on request. We offer a series of Teams meetings throughout the evaluation to help you quickly step up the learning curve and enable you to see the results for yourself.