In this month’s behind the scenes look at the development of our software, we turn our attention to the latest developments in Velit /VelPAK, where we will review seven developments since our last update. The following snapshots of the software are not in a finished state, as they are missing the help pages and perhaps the final aesthetic details of the finished product.
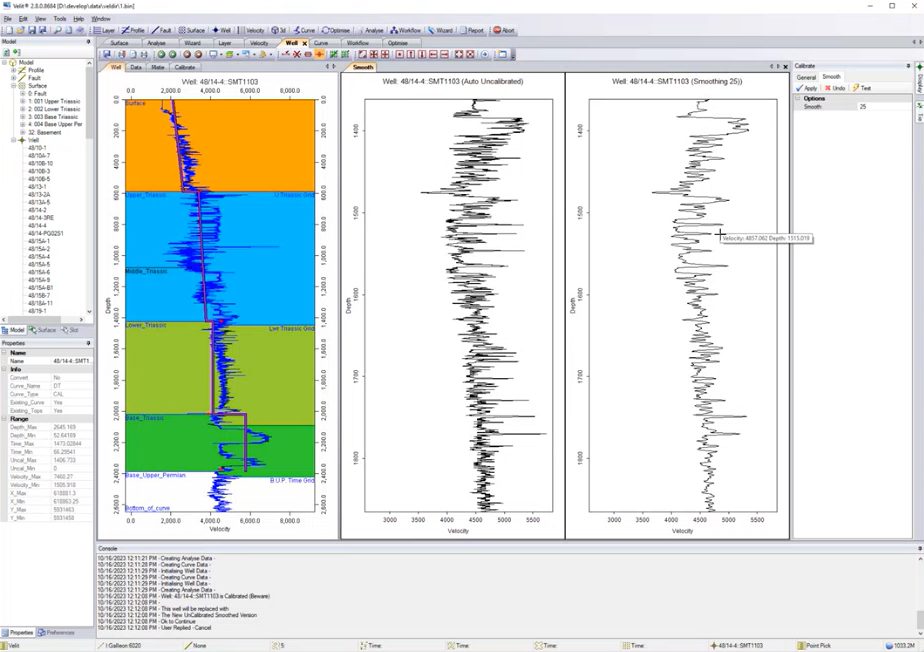
Log Smoothing
We have now incorporated the ability to perform a smoothing operation on your sonic log data which resamples the data between 3 and 25 samples. This feature is located in the Well Module as part of the Calibrate fly-out. The software also permits you to Undo any changes if required.
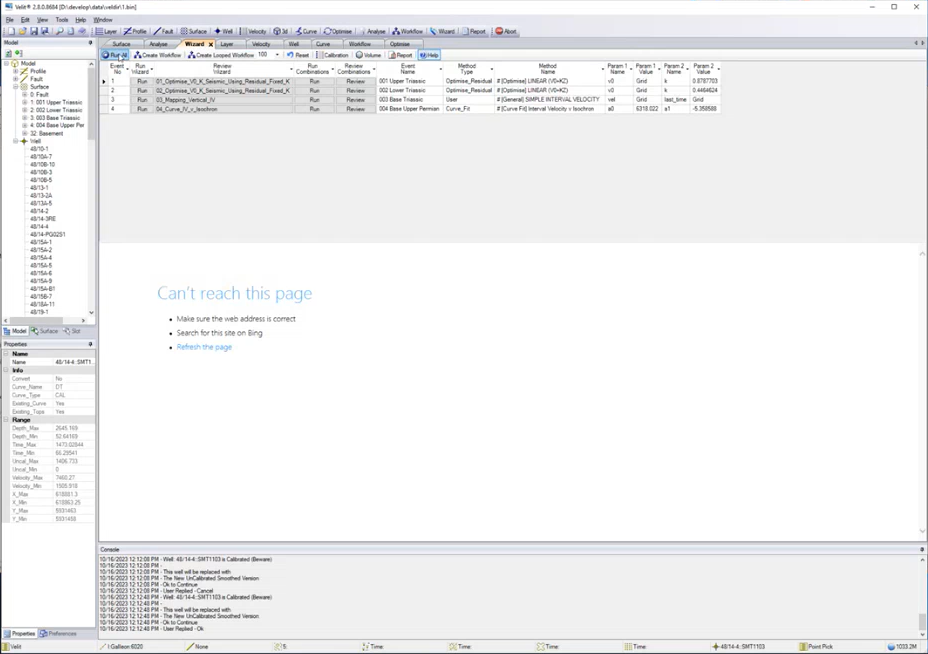
Automated Wizard Functionality
We have included a new button within the Wizard called “Run All” which will serve as a time saver and enable you to select different methods per layer and automatically depth convert all layers in sequence. This enhancement will save you from having to manually re-run all layers after the layer you made a change on, which should enhance your opertional efficiency.
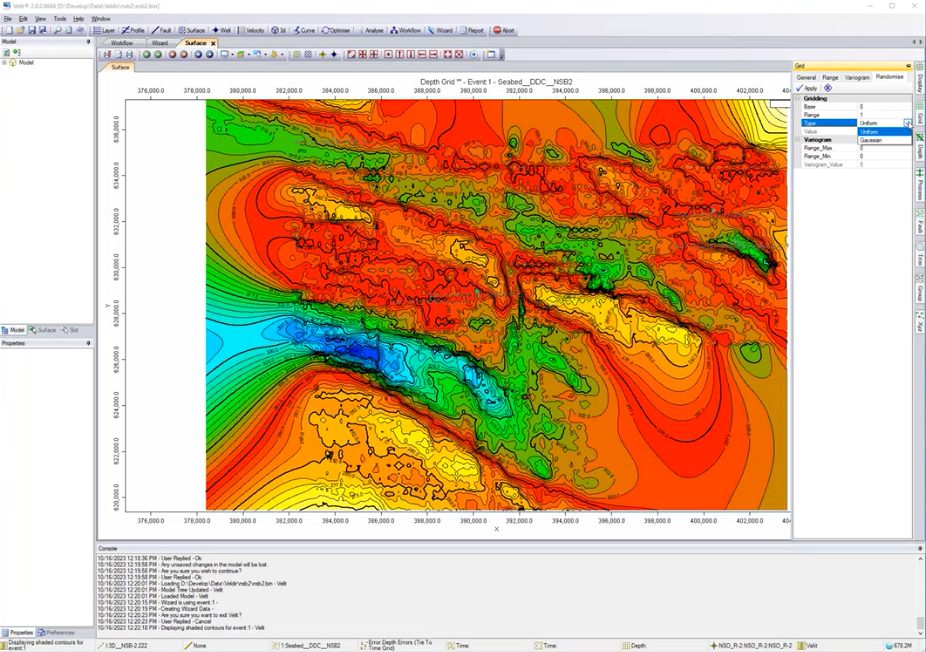
Gaussian Randomisation
Within the Grid flyout you are now able to leverage a gaussian randomisation of of your data, which can we useful as part of your stochastic depth conversion workflows.
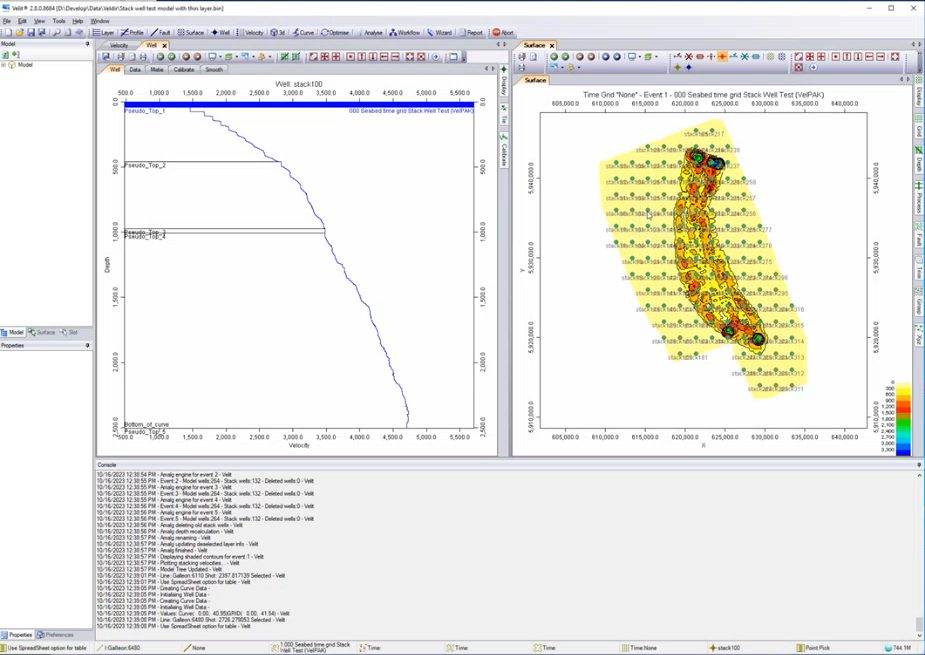
Pseudo-wells For Thin Layers
One issue that was identified recently was that the software could not resolve the creation of a pseudo-well for a thin layer which contained no velocity information. This issue has been overcome such that it will use average values in the event of a lack of data sampling an interval.
New Multiple Realisation Options
One of the most powerful aspects of Velit/VelPAK is the ability to automatically create 1000 depth models around your Best Technical Case model and sum the maps together to determine the probability of structural closure of your reservoir. The latest enhancement is a precursor to being able to visualise a 2D cross section of these realisations. The first step we’ve taken with the development in this direction is to enable all the data to be accessible on the surface map, as you can see in the image below.
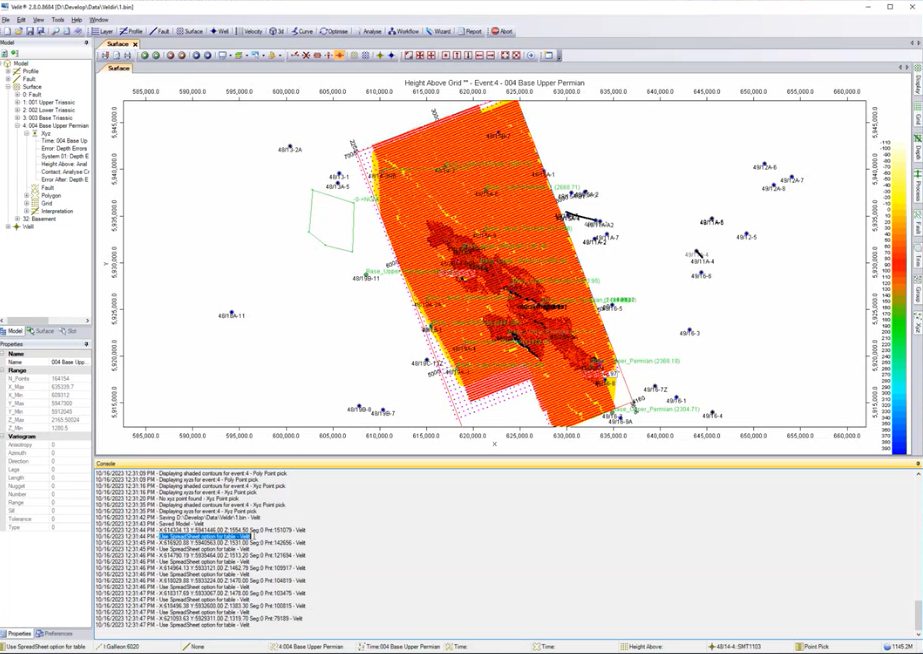
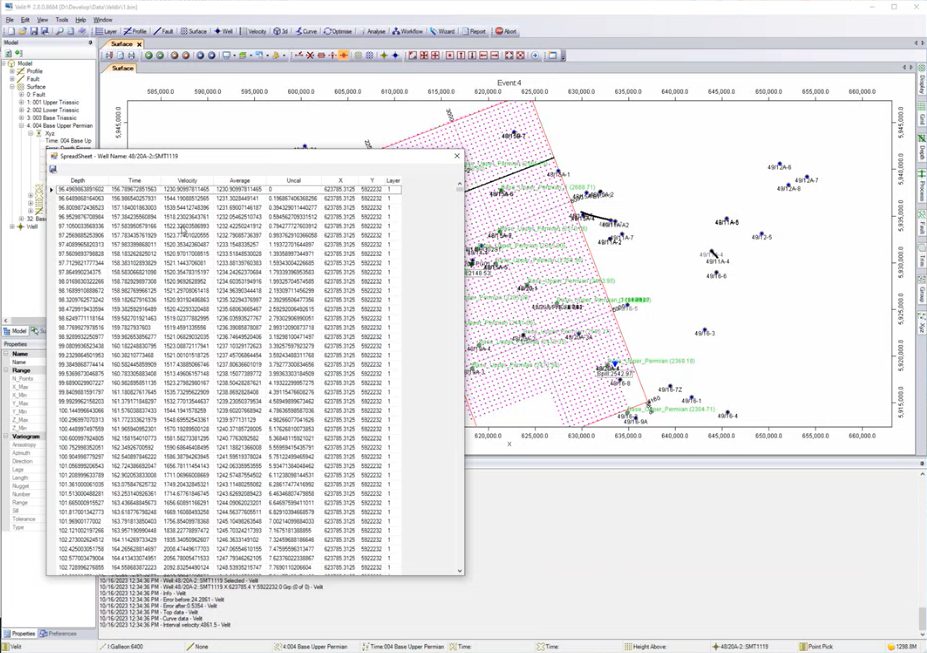
In the “Layers Visible tab” you’re then able to select a new option called “Spreadsheet” which will enable you to access all the data generated at each X, Y and Z location.
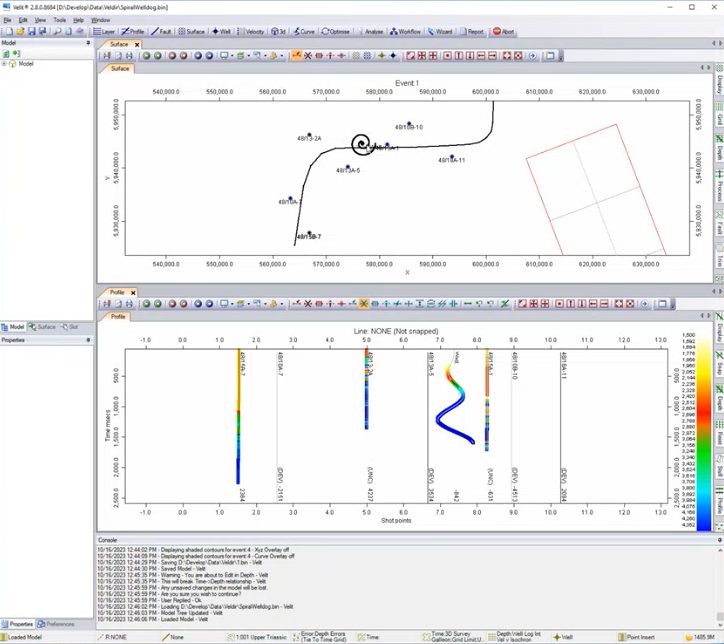
The Profile mode is currently being enhanced to display well information, including the option to display the velocity fill for a well with a user defined colour bar. As you can see in the image below this display will also be able to handle highly deviated well data, as you can see from our dummy ‘spiral well’ in the image below.
It is currently not ready to demonstrate, but these elements will combine to produce a 2D visualisation of all the grids for a target layer, where the multiple realisation operation has been performed. We’ll likely feature this in a few months time, so watch this space for the next update!
If you have any questions about the new developments of our software, or want to discuss our other products, or the depth conversion training courses we provide, then please get in touch with us at sales@equipoisesoftware.com where we’ll be happy to discuss your questions in more detail.