Coloured Inversion: Log Spectrum Analysis
For reflectivity logs, the usual observation is that its amplitude spectrum trend gently rises with frequency – usually described as the “blueness” of the spectrum. The impedance logs however, tend to decay with frequency – having effectively undergone the process of integration relative to the reflectivity data.
The amplitude spectra of the impedance logs (velocity * density) derived for the window of interest can be calculated and displayed on a log-log graph from which a linear spectral slope can be estimated. The fitted line can be expressed as the exponential α in the equivalent representation of the spectral trend in the form A*fα.
If we find α for a field by curve-fitting to AI logs then the amplitude spectrum of the inversion operator is determined as being that which maps the mean seismic spectrum to a curve of form fα.
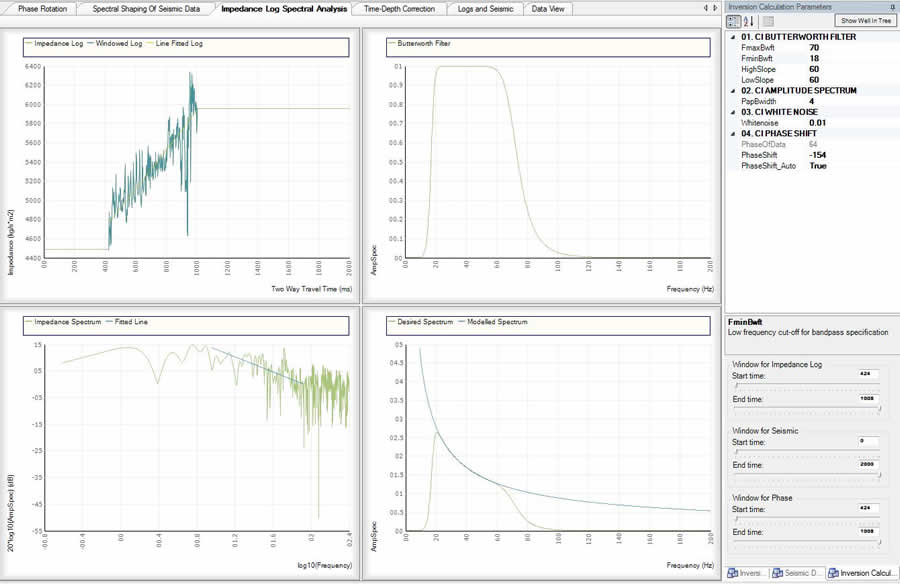
Top Left: Impedance log in the time domain
Top Right: A Butterworth filter defined by FmaxBwft, FminBwft, HighSlope and LowSlope
Bottom Left: Impedance log spectrum and a line fit in a log-log frequency domain
Bottom Right: A desired impedance log spectrum constrained by the Butterworth filter