Coloured Inversion: Seismic Spectrum Analysis
The trend observed in the spectra of the seismic traces must then be matched to the trend of the logs. The seismic spectrum will not in general exhibit the same linear trend behavior, and an operator is therefore computed in the frequency domain to achieve the observed log trend by amplitude multiplication.
A subset of the traces to be input for inversion is selected (and windowed) for spectral analysis as representatives of the complete data set. The amplitude spectra are averaged and smoothed – to enable a smooth spectral shaping operator to be derived to operate on the data.
The smoothing can conveniently be performed within the computation of the amplitude spectrum, by calculating from the autocorrelation of the data. Spectral smoothing is achieved by windowing the autocorrelation – a Papoulis window enables this to be done in a controlled manner without introducing undesirable side-lobes in the spectrum.
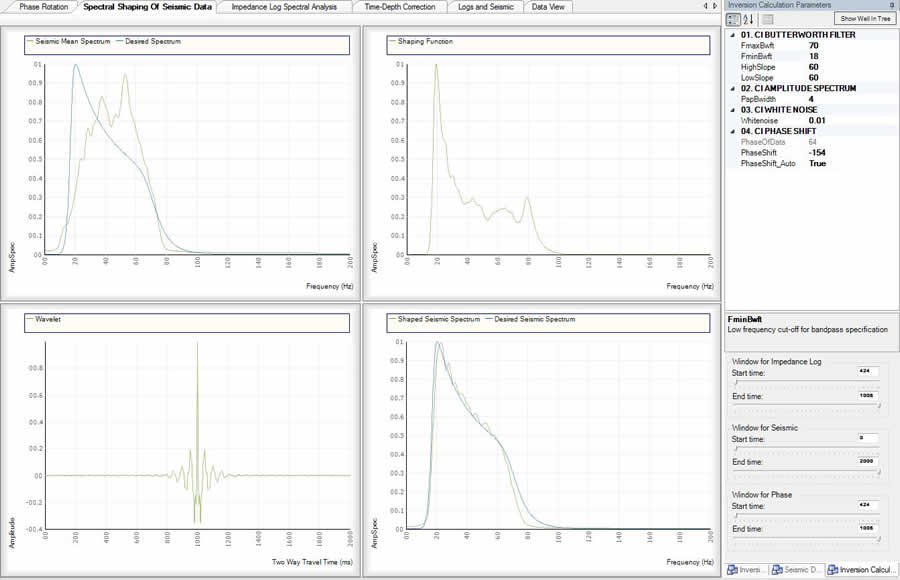
Top Left: Average seismic spectrum superimposed by the desired impedance log spectrum
Top Right: A derived operator in the frequency domain
Bottom Left: A derived operator in the time domain
Bottom right: Shaped seismic spectrum superimposed by the desired impedance log spectrum